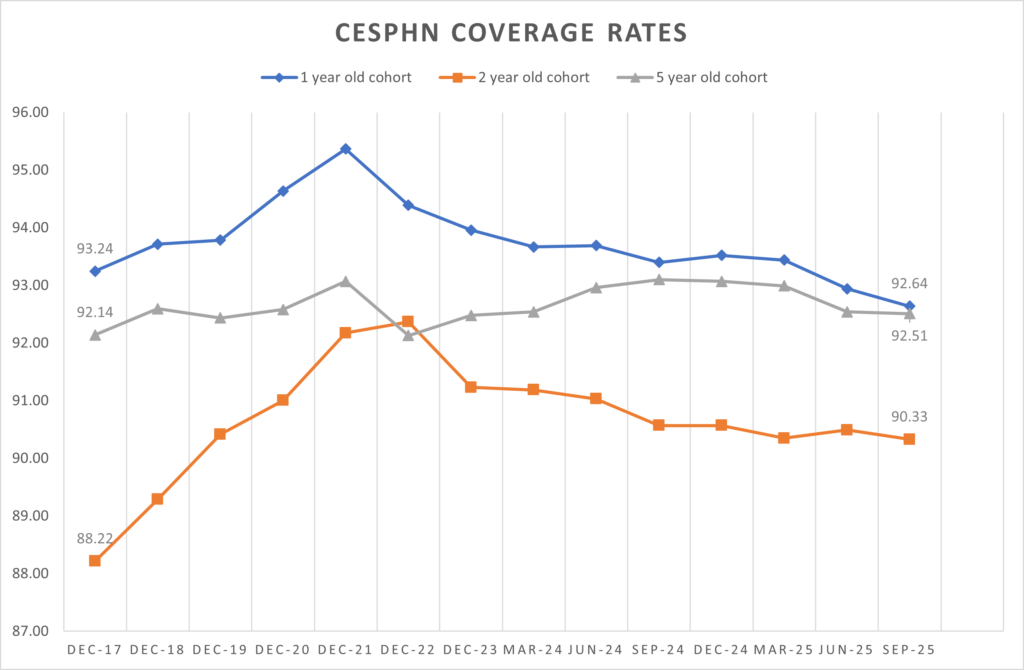
Childhood immunisation coverage is the percentage of children in Australia who have had all the vaccines recommended for their age in the National Immunisation Program Schedule. Monitoring these statistics lets us keep track of how protected we are against vaccine-preventable diseases.
Our quality improvement page has more information on practical ways your practice can contribute to improving these statistics for your practice and our region.
The latest data on childhood immunisation coverage by Primary Health Network (PHN) and Statistical Areas Level 3 (SA3) for all children and Aboriginal and Torres Strait Islander children is available on the Department of Health, Disability and Ageing website.

Data Source: Department of Health childhood immunisation coverage data
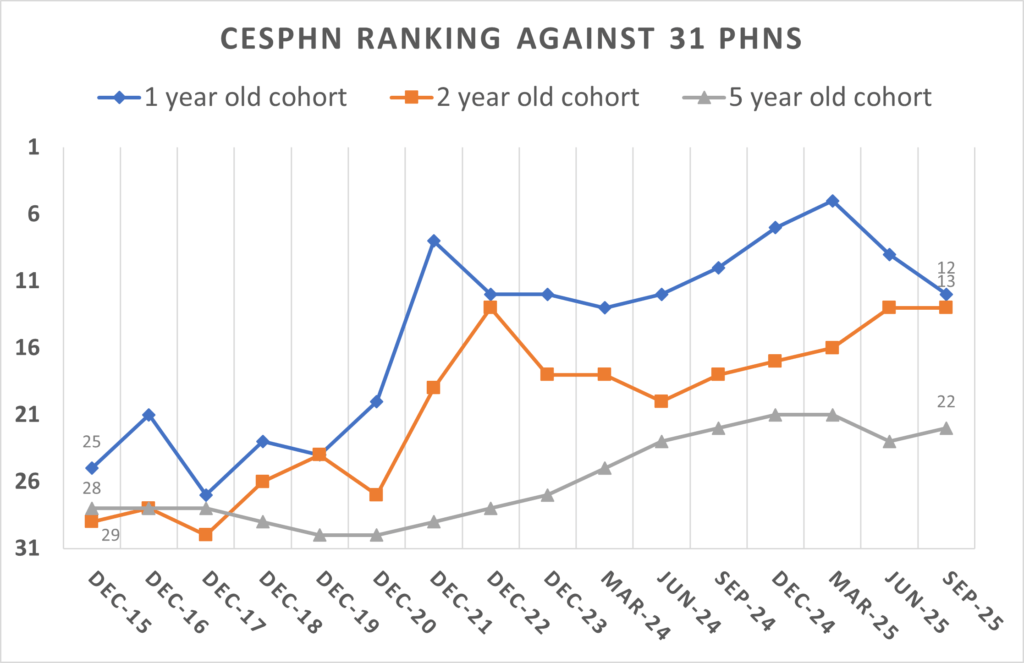
There are 31 Primary Health Networks (PHN) in Australia.

Data Source: Department of Health childhood immunisation coverage data
Quarterly childhood coverage rates are calculated by:
Coverage rates are then calculated as being the children in a cohort that are ‘Fully Immunised’ as a proportion of all children in that cohort.
A child belongs to a specific age cohort (e.g. five year olds) if they turned that age between three and six months before the end of the reporting period.
For example, for someone to be included in the five year olds cohort in the June 2021 quarter, they must have turned five between 1 January 2021 and 31 March 2021 i.e. they must have been born between 1 January 2016 and 31 March 2016.
When determining whether a child is ‘Fully Immunised’, the following tables show the vaccinations that are assessed for each age cohort. A child is considered to be ‘Fully Immunised’ if all vaccinations for the cohort have been recorded in the AIR by the end of the reporting period.
One year olds
| Vaccine | Requirement to be considered ‘Fully Immunised’ |
| DTP | Diphtheria dose 3 + Tetanus dose 3 + Pertussis dose 3 |
| Polio | Polio dose 3 |
| Hib | Haemophilus type B (Pathway A*) dose 3 or Haemophilus type B (Pathway B*) dose 2 |
| Hep B | Hepatitis dose 3 |
| Pneumo | Pneumococcal dose 2 |
Two year olds
| Vaccine | Requirement to be considered ‘Fully Immunised’ |
| DTP | Diphtheria dose 4 + Tetanus dose 4 + Pertussis dose 4 |
| Polio | Polio dose 3 |
| Hib | Haemophilus type B (Pathway A*) dose 4, or Haemophilus type B (Pathway A*) dose 3 (if given greater than 11½ months of age) or Haemophilus type B (Pathway B*) dose 3, or dose 4** |
| Hep B | Hepatitis B dose 3 |
| Pneumo | Pneumococcal dose 3 |
| MMR | Measles dose 2 + Mumps dose 2 + Rubella dose 2 |
| Men | Meningococcal C dose 1 |
| Var | Varicella dose 1 |
Five year olds
| Vaccine | Requirement to be considered ‘Fully Immunised’ |
| DTP | Diphtheria dose 5 + Tetanus dose 5 + Pertussis dose 5 or Diphtheria dose 4 + Tetanus dose 4 + Pertussis dose 4 (if given after 3.5 years of age) |
| Polio | Polio dose 4 |
Notes
* The vaccines used to determine the appropriate Hib Pathway (A or B) are as follows:
** Both Dose 3 and Both 4 are included in Pathway B for two year olds to account for previous changes to Hib rules.
Ideally, vaccinations should not be administered earlier than the intended time point as they may not be accepted as valid doses by AIR. If the child need to receive vaccinations sooner for extenuating circumstances, please contact AIR to discuss if this is acceptable.
Source: Department of Health and Aged Care website, updated August 2021
January 2025
NCIRS: Impact of No Jab No Pay policy on vaccine uptake
A study that analyses the impact of Australia’s No Jab No Pay policy on vaccination uptake.
October 2024
NCIRS: Ongoing decline in childhood immunisation rates sparks concerns
This media release – Vaccination coverage rates among children in Australia have declined for the third consecutive year.
July 2024
Grattan Institute: Patchy protection – How to boost GPs’ patient vaccination rates
This report sheds new light on how to better support GPs by looking deeper into patterns of vaccination rates.
AIWH: Immunisation and vaccination
This article looks at the impact of vaccination in Australia and immunisation coverage rates.
December 2023
NCIRS: Vaccination coverage in children continues to decline
This report shows vaccination coverage in children has continued to decrease since the onset of the COVID-19 pandemic, highlighting the need for further targeted strategies to increase vaccine uptake.
November 2023
NCIRS: The National Vaccination Insights project
National surveillance of drivers of under-vaccination in Australian children aged under 5 years
The Department of Health and Aged Care data tables show the percentage of children fully immunised at one, two and five years of age. The data are for the most recent period available (annual period ending June 2024) and include the percentages for Australia as a whole and each state and territory.
The data show the proportion of children fully immunised at one, two and five years of age according to the National Immunisation Program Schedule.
A full description of the methodology used can be found in Communicable Diseases Intelligence 1998, volume 22, issue 3 (pages 36 to 37).
